Math 105, Topics in Mathematics
Lesson 5: Normal Distribution
Introduction 
The shape of the bar graphs and histograms of almost any kind of numerical data that we encounter in nature resembles a bell-shaped pattern. A perfect such bell shape is shown in the following diagram:
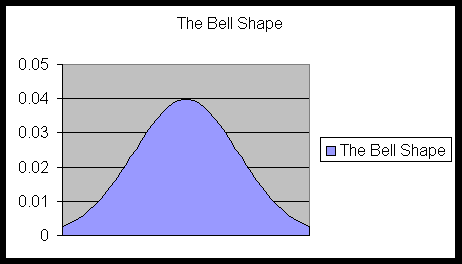
To see a flash animation of the bell shape curve
Click here.
Now let us compare some bar charts with this bell-shaped figure.
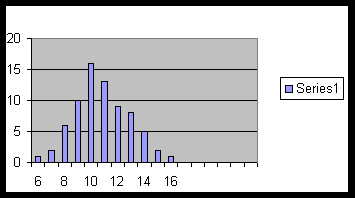
Example 5.0.1. The following is the frequency table of the scores obtained by a group of students:
| Scores | 6 | 7 | 8 | 9 | 10 | 11 | 12 | 13 | 14 | 15 | 16 |
|---|---|---|---|---|---|---|---|---|---|---|---|
| Frequency | 1 | 2 | 6 | 10 | 16 | 13 | 9 | 8 | 5 | 2 | 1 |
The following is the bar graph of this data:
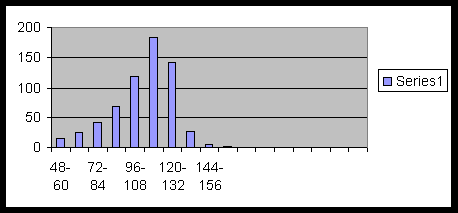
Example 5.0.2. Following is the class frequency table of weight (in pounds) of some babies:
| Class Intervals | 48-60 | 60-72 | 72-84 | 84-96 | 96-108 | 108-120 | 120-132 | 132-144 | 144-156 | 156-168 |
|---|---|---|---|---|---|---|---|---|---|---|
| Frequency | 15 | 24 | 41 | 67 | 119 | 184 | 142 | 26 | 5 | 2 |
The following is the bar graph of this data:
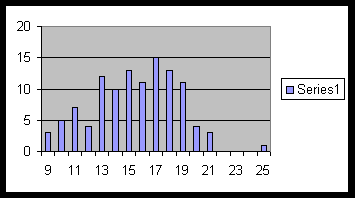
Example 5.0.3. The following is the frequency table of hourly wages of a group of workers:
| Wages | 9 | 10 | 11 | 12 | 13 | 14 | 15 | 16 | 17 | 18 | 19 | 20 | 21 | 22 | 23 | 24 | 25 |
|---|---|---|---|---|---|---|---|---|---|---|---|---|---|---|---|---|---|
| Frequencies | 3 | 5 | 7 | 4 | 12 | 10 | 13 | 11 | 15 | 13 | 11 | 4 | 3 | 0 | 0 | 0 | 1 |
The following is the bar graph of this data :
Example 5.0.4. The following is the percentage frequency table of the weight of a large number of salmon:
| weight (in pounds) |
20- 24 |
25- 29 |
30- 34 |
35- 39 |
40- 44 |
45- 49 |
50- 54 |
55- 59 |
60- 64 |
65- 69 |
70- 74 |
75- 80 |
|---|---|---|---|---|---|---|---|---|---|---|---|---|
| Percentage Frequencies |
1.1 | 1.9 | 4.3 | 8.7 | 13.2 | 17.8 | 17.3 | 14.6 | 10.6 | 6.1 | 2.8 | 1.6 |
The following is the bar graph :
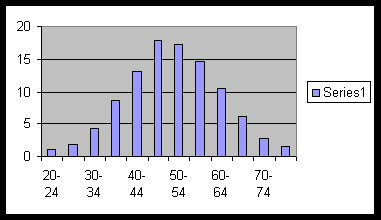
You can see that all these bar graphs fit into a nice bell-shaped curve. Some fit into the bell shape better than the other graphs.
Perhaps the most amazing fact in statistics is that bar graphs of almost any kind of numerical data in nature fits nicely into a bell-shaped curve. How well a data set fits into a perfect bell-shaped curve largely depends on the size of the data. If the data set is large, then the bar graph or the histogram almost always fits into a perfect bell-shaped curve.
In this chapter we consider data sets whose bar graph or the histogram fits into a perfect bell-shaped curve. In fact, we talk about population data whose bar graph or histogram fits into a perfect bell-shaped curve. At this point it is helpful to recall the discussion on variables.
5.1 Random Variables
Recall the following definition of variables.
Definition: A variable is a characteristic of the population members that varies with each member of the population.
We do not distinguish between "variables" and "random variables" (as many textbooks do). I only want to mention that a variable, in the context of random experiments and sample spaces is called a random variable. A random variable X assigns a value to each outcome (and a variable assigns a value to each population member). In other words, here the sample space S takes the place of the population.
Example 5.1.1. Suppose we want to study the KU student population. Our random experiment is to select a KU student randomly. So, the sample space S, in this case, is the KU student population, and each student is an outcome. Now all the variables that we considered in the example of KU student population (in lesson 2) are also random variables. GPA, weight, height, and annual income of KU students are random variables.
5.2. Normal Distribution and Normal Random Variables
- Definition. A data set (or a variable X) is said to be normally distributed if the bar graph or the histogram fits into a perfect bell-shaped curve. We also say that X has normal distribution or X is a normal random variable. Also, the corresponding bell-shaped curve is called the normal curve of X (or of the data set).
- If the bar graph or the histogram fits approximately into a perfect bell-shaped curve, then we say that the data set (or the variable) is approximately normally distributed.
- Definition. Such a perfect bell-shaped curve as above is called a normal curve. Examine the animated normal curve.
- Remark. As we have seen in the introduction, it is often the case in nature that your data set will fit into such a normal curve, approximately, even if not perfectly.
Properties of Normal Curves:
Suppose X is a random variable that has normal distribution. Let us denote the mean (average) value of X by μ and the standard deviation by σ. Following are some properties of the normal curve of X.
- Symmetry: The normal curve of X is symmetric about a vertical line through the mean μ on the horizontal axis. This line is also called the line of symmetry. The two halves of the normal curve on two sides of this line of symmetry are the mirror images of each other.
- Center: The point where this line of symmetry
of the normal curve cuts the horizontal axis is called the center
of the normal curve. So, the x-value (or the data value) of the line
of symmetry is the center. In fact,
μ = mean of X = median of X = center.
We say that the normal curve is symmetric around the mean.
- On the Shape of the Normal curve: If the standard deviation σ is large, then the normal curve is flat. If σ is small, then the normal curve is tall and stiff. But, once the value of μ and σ are known, the shape is completely determined. Examine the animation.
- Theorem. If X is a normal random variable with mean μ and standard deviation σ, then Z = (X-μ)/σ is also a normal random variable with mean ZERO and standard deviation ONE.
- This Z is called the standard normal variable. The process of converting X to Z is called the standardization of X.
- Definition. If X = x is the value of X,
then
z = (x-μ)/σ
is called the standardized value of X. We also call it the z-value of x.
- Definition. If x and y are two values
of X (with x < y), then we say that x and y are
(y-x)/σ - standard deviation apart
from each other.
Remark: In statistics , the standard deviation is used as an unit. A statement like "the birth weight of two babies differ by a pound" is of little value to a statistician. A statistician would like to know how many standard deviation apart are the birth weights of these two babies.
Example 5.2.1. Suppose it is known that the annual income X of the U.S. population is normally distributed with mean μ = $37,000.00 and standard deviation σ = $13,000.00. (My data is not real data.)
- The annual income of a professor is $64,000, and his GTA's annual
income is $12,000.00. How many standard deviations apart are the income
of the professor and the GTA?
The Solution (y-x)/σ = (64,000-12,000)/13,000 = 4 standard deviations. - The chairman's annual income is $77,000.00. How many standard deviations
apart are the income of the professor and the chair?
The Solution (y-x)/σ = (77,000-64,000)/13,000 = 1 standard deviation. - How many standard deviations apart are the income of the GTA and
the chair?
The Solution (y-x)/σ = (77,000 - 12,000)/13,000 = 5 standard deviations.
Example 5.2.1-B.
The weight X salmon in a river has normal
distrubution with mean μ = 37 pounds and
standard deviation σ = 8 pounds.
The weight of a salmon you caught recently is 18 pounds.
The weight of a salmon that your friend caught is 30 pounds.
How many standard deviation apart are the these two fish?
Answer:
Suppose that a data set (or a random variable) has normal distribution. Then we have following facts:
- The data whose standardized values are between
-1 and 1 represent 68 percent of the data.
- In other words, the probability that the z-value of a data value x is between -1 and 1 is 0.68. So P(-1 < Z < 1) = 0.68.
- The same is expressed by saying that 68 percent of the data values are within one standard deviation σ from the mean μ.
- It follows that the probability that z-value of a data is not between -1 and 1 is 1-0.68= 0.32.
- The data whose standardized values are between -2 and 2 represent 95 percent of the data. In other words, the probability that the z-value of a data value x is between -2 and 2, is 0.95. So P(-2 < Z < 2) = 0.95. So the probability that z-value of a data is not between -2 and 2 is 1 -0.95 = 0.05.
- The data whose standardized values are between -3 and 3 represent 99.7 percent of the data. In other words, the probability that the z-value of a data value x is between -3 and 3 is 0.997. So P(-3 < Z < 3) = 0.997. So the probability that z-value of a data is not between -3 and 3 is equal to 1-0.997= 0.003.
- Examine the flash animation on 68-95-99.7-Rule.
- There are many tables and software programs that give you the probability.
I give you a table that gives you probability that the z-value
is within two given numbers.
- In addition to the z-tables, you must use the symmetry
and other facts to compute
probability. For example
- To compute probability, first we must standardize and reduce it to a z-problem.
- The total area under the normal curve above x-axis is 1.
- The area under the normal curve on either side of the
y-axis is one half. That means
P( Z > 0) = 0.5.
P( Z < 0) = 0.5. - For example : P(0 < Z <1) = P(-1< Z < 1)/2 = 0.68/2 = 0.34.
- Half the data are bigger than μ. In other words
P( X > μ) = 0.5.
Similarly, P( X < μ) = 0.5.
Quartiles:
- From the tables one can compute the z-value of the third quartile
Q3 is
(Q3-μ)/σ = 0.675.
- So the third Quartile is given by :
Q3= μ + 0.675 σ.
- Similarly the first quartile is:
Q1= μ - 0.675 σ.
Example 5.2.2. Suppose scores X of students on certain test (like SAT) are approximately normally distributed with mean μ = 70 and standard deviation σ = 10 points. Suppose 1500 students take the test.
- Estimate the average score on the test.
- Estimate what percent of students scored 70 or more?
- Estimate what percent of the students scored between 60 and 80?
- Estimate what percent of students scored more than 80?
| The Solutions |
|---|
|
Example 5.2.3. Let us have the same set up as in the above problem. Suppose that 1500 students took the test.
- Estimate how many students scored between 60 and 80?
- Estimate how many students scored more than 80?
| The Solutions |
|---|
|
Example 5.2.4. Let us have the same set up as above. Estimate the first and the third quartile.
| The Solutions |
|---|
|
Percentiles
For a number p between 0 and 100, your score in a test is (above) p-percentile, if p percent of the students who took the test did not do as well as you did. More formally:
Definition. For a variable X, the pth percentile is a number xp so that P(X < xp) = p/100. In other words, p percent of the data values are less than (or also equal to) xp. So
- The first quartile Q1 is the 25 percentile.
- The median (the mean for normal distribution) is the 50 percentile.
- The third quartile Q3 is 75 percentile.
Example 5.2.5. The distribution of weight of six-month-old baby boys is approximately normal with mean μ = 17.25 pounds and standard deviation σ = 2 pounds.
- Suppose that a six-month-old boy weighs 15.9 pounds. Approximately
what weight percentile is he in?
- Suppose that a six-month-old boy weighs 18.6 pounds. Approximately
what weight percentile is he in?
- Suppose that a six-month-old boy is in the 75th percentile weight. Estimate his weight.
| The Solutions |
|---|
We will first directly compute the quartiles.
|
Problems on 5.2: Probability (using The 68-95-99.7 Rule)
Exercise 5.2.1. Suppose that the weight X at birth of babies have normal distribution with mean μ = 115 ounce and standard deviation σ = 17 ounces. Use the 68-95-99.7 rule and do the following:
- What proportion of babies have weight, at birth, between 115 and 132 ounces? Solution
- What proportion of babies have weight, at birth, between 115 and 149 ounces? Solution
- What proportion of babies have weight, at birth, between 98 and 149 ounces? Solution
- What proportion of babies have weight, at birth, between 81 and 132 ounces? Solution
- What proportion of babies have weight, at birth, between 132 and 149 ounces? Solution
Exercise 5.2.2. Suppose that the length X of salmon in a river have normal distribution with mean μ = 17 inches and standard deviation σ = 4 inches. Use the 68-95-99.7 rule and do the following:
- What proportion of salmon in the river are between 17 inches and 21 inches? Solution
- What proportion of salmon in the river are between 13 inches and 21 inches? Solution
- What proportion of salmon in the river are between 9 inches and 17 inches? Solution
- What proportion of salmon in the river are between 9 inches and 21 inches? Solution
Problems on 5.2: Percentiles
Exercise 5.2.3. The distribution of weight for twelve-month-old baby girls is approximately normal with mean μ = 21 pounds and standard deviation σ = 2.2 pounds.
- Suppose that a twelve-month-old girl weighs 22.49 pounds. Approximately what weight percentile is she in?
- Suppose that a twelve-month-old girl weighs 19.52 pounds. Approximately what weight percentile is she in?
- Suppose that a twelve-month-old girl is in the 75th percentile weight. Estimate her weight.
Exercise 5.2.4. The distribution of weights for one-month-old baby girls is approximately normal with mean μ = 8.75 pounds and standard deviation σ = 1.1 pounds.
- Suppose that a one-month-old girl weighs 8.01 pounds. Approximately what weight percentile is she in?
- Suppose that a one-month-old girl weighs 9.49 pounds. Approximately what weight percentile is she in?
- Suppose that a one-month-old girl is in the 75th percentile weight. Estimate her weight.
Exercise 5.2.5. The distribution of weights for one-month-old baby boys is approximately normal with mean μ = 22.5 pounds and standard deviation σ = 2.2 pounds.
- Suppose that a twelve-month-old boy weighs 21.99 pounds. Approximately what weight percentile is he in?
- Suppose that a twelve-month-old boy weighs 21.02 pounds. Approximately what weight percentile is he in?
- Suppose that a twelve-month-old boy is in the 75th percentile weight. Estimate his weight.
5.3 Computing Probability and Use Tables
We have discussed both discrete and continuous random variables. We note here that a normal random variable X is a continuous random variable.
For a normal random variable X, we only used the 68-95-99 rule to compute the probability that X is within 1, 2, or 3 standard deviations σ from the mean μ. We will learn to use probability tables to compute the probability that X is within any two given numbers.
First, we can rephrase the definition of the normal distribution as follows:
Suppose that a random variable X (or a data set) has normal distribution with mean μ and standard deviation σ. Then the relative frequency histogram of the data fits into a a perfect bell-shaped curve as follows.

This bell-shaped curve is called a normal curve.
Now we have the following:
- A normal curve is symmetric around the vertical line through the mean μ.
- The total area under the normal curve and above the horizontal axis (x-axis) is one. So on two sides of the line of symmetry the area under the graph is one-half.
- The probability rule: The probability
that X is between two given numbers a and b (with a ≤ b) is
equal to the area under the normal curve, above the x-axis and between
the vertical lines x = a and x = b. So
P(a < X < b) = P(a ≤ X < b ) =
P(a < X ≤ b) = P(a ≤ X ≤ b) =
the area under the normal curve, above the x-axis (of X)
and between the vertical lines x = a and x = b.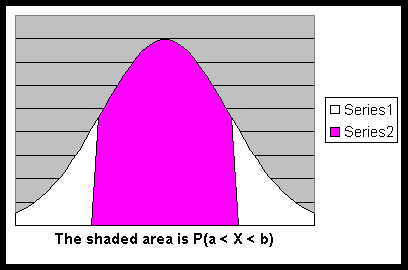
Also look at the animation for Normal Probability. - The formula also works if a = - ∞
is negative infinity and b ∞ is infinity.
That means,
P( X ≤ b) = P( X <b) =
the area under the normal curve (of X), above the x-axis
and on the left side of the vertical line x = b.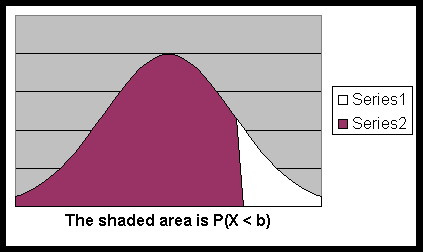
and
P(a < X) = P(a ≤ X) =
the area under the normal curve (of X),
above the x-axis and on the right side of x = a.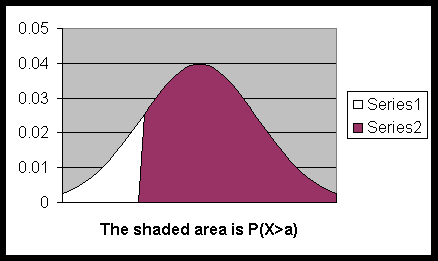
- It follows that for any number a, we have P (X=a) = 0. This is very much in contrast with the case of discrete variables.
The Z-Table
Recall that the normal random variable with mean μ = 0 and standard deviation σ = 1 is called standard normal random variable (denoted by Z). Tables are available that you can use to compute the probability for a standard normal random variable. I have compiled a probability table for Z random variable. This table was compiled to specifically meet the needs of this class.
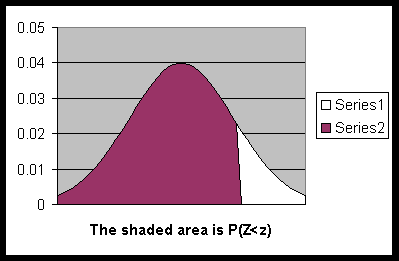
For various values of z, the table gives P(Z < z), which is the above shaded area as in this diagram.
Computing Probability for a Normal Random Variable
Suppose X is a normal random variable with mean μ and standard deviation σ.
- Then
Z = (X - μ) / σ
is a standard normal random variable.
- The Final Formula:
P(a < X < b)
= P((a-μ)/σ <(X-μ)/σ < (b - μ)/σ)
= P((a-μ)/σ < Z < (b - μ)/σ)
= The difference of the two numbers to be read from the z-table.
Example 5.3.1. The length X of life of some light bulbs produced in a factory is normally distributed with mean μ = 8640 hours and standard deviation σ\ = 1440 hours.
- Find the probability of the event E that a bulb will last less than 5040 hours.
- Find the probability of the event F that a bulb will last between 5040 hours and 8640 hours.
| The Solutions |
|---|
|
Example 5.3.2. The length X of a fish in a lake has normal distribution with mean 67 cm and standard deviation 21 cm. What proportion (i.e., probability) of fish have length between 44 cm and 110 cm?
| The Solutions |
|---|
Here we are asked to find P(44 < X < 110). We have
|
Example 5.3.3. The diameters of the pumpkins in my patch have normal distribution with mean 13 inches and standard deviation 4.5 inches. What proportion (i.e., probability) of pumpkins is above 22 inches?
| The Solutions |
|---|
Here we are asked to find P(22 < X).
|
Example 5.3.4. The amount of vegatable oil
X produced by a machine in a day is normally distributed with μ
= 130 liters and standard deviation σ = 25 liters. What is the
probability that a machine produces between 120 liters and 150 liters
each day?
Solution
| The Solutions |
|---|
Here we are asked to find P(120 < X < 150).
|
Problems on 5.3: Probability (using the Probability Table )
Exercise 5.3.1. Let Z be the standard normal random variable.
- Find the probability P(-1.1 < Z < 2.5).
- Find the probability P(Z < -2.1).
- Find the probability P(-2.1 < Z < -1.5).
- Find the probability P(1.5 < Z).
Experiment with the normal-animation.
Solution
Exercise 5.3.2. Let X be a normal random variable with mean μ = 3 and standard deviation σ = 1.5 .
- Find the probability P(-1.1 < X < 2.5).
- Find the probability P(X < -2.1).
- Find the probability P(-1.2 < X < -0.5).
- Find the probability P(1.5 < X).
Experiment with the normal-animation.
Experiment with the Solution
Exercise 5.3.3. The telephone company's data shows that length
X of their international calls has normal distribution with mean 11.5
minutes and standard deviation 4.3 minutes. The company decided to give
a special rate for the longest 20 percent calls. What percentage of
international calls last between 5 minutes and 15 minutes?
Exercise 5.3.4. The annual expenditure X of a student is approximately
normally distributed with mean μ = 11,000 dollars and standard
deviation σ = 1500 dollars. What percentage of students spend less
than 10,000 dollars?
Solution
Exercise 5.3.5. Suppose the annual production X of milk per cow
is normally distributed with μ = 5500 liters and standard deviation
σ = 150 liters. What percentage of cows have annual yield less
than 5155 liters?
Solution
Exercise 5.3.6. The weight X at birth of babies is normally distributed
with mean μ = 114 oz. and standard deviation σ = 18 oz. What
percentage of babies have birth weight below 141 oz.?
Solution
Problems added from 365
Exercise 5.2.4. The length X of a fish in
a lake has normal distribution with mean 67 cm and standard deviation
21 cm. What proportion (i.e, probability) of fish are between 44 cm
and 110 cm long?
Solution
Exercise 5.2.5. The diameter of the pumpkins
in my patch has normal distribution with mean 13 inches and standard
deviation 4.5 inches. What proportion (i.e., probability) of pumpkins
is above 22 inches?
Solution
Exercise 5.2.7. Suppose the annual production
X of milk per cow is normally distributed with μ
= 5500 liters and standard deviation σ
= 150 liters. What percent of cows have annual yield less than 5155
liters?
Solution
Exercise 5.2.8. The amount of vegetable oil
X produced by a machine in a day is normally distributed with μ
= 130 liters and standard deviation σ
= 25 liters. What is the probability that a machine will produce between
120 liters and 150 liters on a day?
Solution